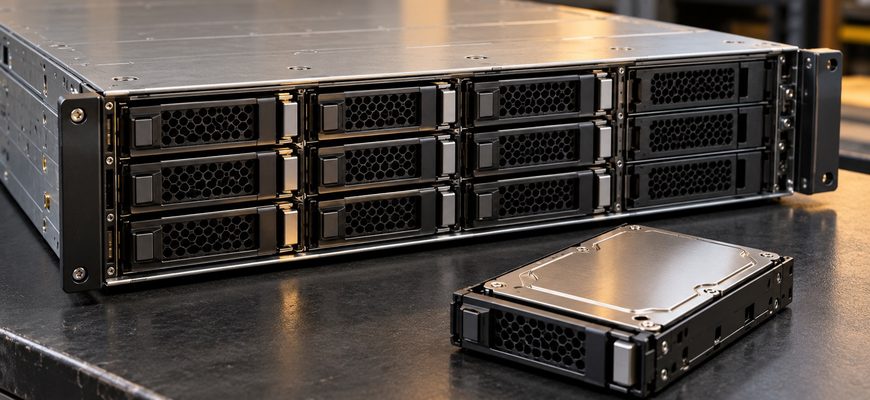
Backup server storage should be purchased against retention and recovery requirements, not raw terabytes alone. Choose fewer larger HDDs when the complete repository meets its backup, restore, and degraded-operation targets while preserving useful expansion room. Choose more populated bays when additional disk parallelism is needed and verified for the workload. Neither approach wins automatically on capacity or price.
The distinction matters when two quotations offer similar protected capacity. A repository that stores every required recovery point can still miss the restore deadline. Conversely, filling every bay to gain unnecessary performance can make the next capacity increase more disruptive and expensive.
- Separate chassis capacity from installed drive count
- Size backup server storage from the retained backup set
- Compare equal protected capacity before comparing prices
- Make the restore deadline a hardware acceptance test
- Compare recovery under a failed-drive condition
- Price the growth method, not just the empty bays
- Calculate cost across eligible configurations
- Choose the configuration that meets the recovery contract
Separate chassis capacity from installed drive count
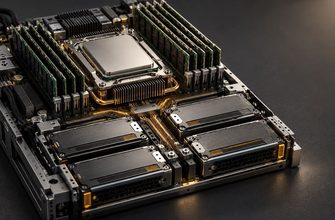
Buying more bays and installing more disks are separate decisions. A larger chassis can start partially populated, preserving expansion positions without immediately buying every drive. A smaller chassis filled with high-capacity HDDs may provide sufficient storage today but fewer internal expansion options.
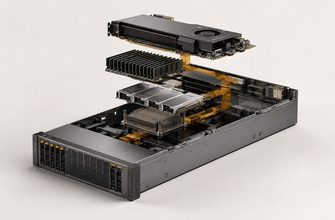
However, a visible bay is not necessarily a ready-to-use connection. Verify the backplane, controller or HBA, cables, drive carriers, cooling, and supported drive population. Include those components in the quotation rather than assuming they can be added inexpensively later.
The Lenovo ThinkSystem SR650 V3 product guide illustrates why the ordered configuration matters: its front 3.5-inch arrangements include eight or twelve bays, with additional storage configurations using middle or rear positions. Supported combinations depend on the chassis, backplanes, and other configuration choices. A platform maximum is not the delivered server’s expansion map.
Size backup server storage from the retained backup set
Begin with the repository footprint required by the actual backup policy. Production data size alone is insufficient. Record retention periods, full and incremental backup methods, change rates, expected growth, and any overlapping backup chains.
Use measured compression and deduplication where available. Already compressed or encrypted source data should not receive an optimistic reduction assumption without evidence. Document temporary workspace separately from retained recovery points.
Veeam’s repository storage guidance identifies backup frequency, retention, chain type, change rate, growth, and block cloning as capacity inputs. It also calls for additional resources for health checks and space allowances for relevant backup operations. Apply the documentation for your selected backup product and version.
Distinguish raw disk capacity, nominal capacity after redundancy, filesystem-available space, and the maximum planned repository occupancy. These are different purchasing numbers. A free-space allowance is a planning decision; it does not eliminate filesystem overhead or replace workload-specific sizing.
Compare equal protected capacity before comparing prices
Illustrative scenario: a buyer is considering two configurations in a qualified twelve-bay server. Both use one RAID 6 group, separate boot storage, and equal-sized enterprise HDDs within each group. Both must accommodate a projected 90 TB repository footprint, including identified operational workspace. The buyer also sets an assumed 80% occupancy ceiling.
For these calculations, TB means decimal terabytes. Broadcom’s MegaRAID software guide gives nominal RAID 6 capacity as the number of member drives minus two, multiplied by the smallest member’s capacity. Formatting and implementation overhead must still be deducted.
| Purchase criterion | 12 × 12 TB HDDs | 8 × 20 TB HDDs |
|---|---|---|
| Raw capacity | 144 TB | 160 TB |
| Nominal RAID 6 capacity | (12 − 2) × 12 = 120 TB | (8 − 2) × 20 = 120 TB |
| 80% of nominal capacity | 96 TB before overhead adjustment | 96 TB before overhead adjustment |
| Unpopulated data bays | 0 | 4 |
| Member drives sharing the workload | 12; performance requires testing | 8; performance requires testing |
Both candidates provide the same nominal protected capacity despite different raw totals. Confirm that 90 TB remains within 80% of the actual formatted volume. The four unpopulated bays in the second option are potential expansion positions, not immediately usable repository capacity.
Assume a compatible cold spare is purchased separately for each candidate and stored outside the chassis. An installed hot spare would consume another bay without increasing the RAID group’s nominal data capacity. If a hot spare is required, revise both configurations before comparing them.
Make the restore deadline a hardware acceptance test
More active HDDs can provide additional parallel disk service, but drive count does not establish application throughput. Controller limits, parity operations, access patterns, concurrent jobs, and the network can change the result. Do not multiply a drive’s advertised maximum transfer rate by its quantity and call that repository performance.
Illustrative scenario: the same purchase specification requires 12 TB of repository writes within eight hours and a 20 TB restore within six hours. These are assumed data volumes at the relevant test boundaries, not production-size estimates inferred from compression ratios.
- Backup write requirement: 12,000,000 MB ÷ 28,800 seconds = approximately 417 MB/s.
- Restore delivery requirement: 20,000,000 MB ÷ 21,600 seconds = approximately 926 MB/s.
These averages leave no allowance for startup delays or slower phases. They are minimum planning rates, not benchmarks. Specify operating margin and an end-to-end completion deadline, including the destination system’s ability to receive restored data.
Test the selected backup application with representative concurrency, occupancy, and maintenance activity. If instant recovery is required, include its access pattern and latency criteria. A successful sequential restore test does not establish acceptable performance for running multiple recovered virtual machines directly from the repository.
Compare recovery under a failed-drive condition
Normal operation is only one acceptance condition. Request evidence that critical backup and restore work remains acceptable during the supported degraded and rebuild states. Specify which jobs may overlap and what completion times the business can tolerate.
Illustrative scenario: if reconstruction must write a full member’s capacity at an assumed effective 100 MB/s, the transfer component is approximately 33.3 hours for 12 TB and 55.6 hours for 20 TB. This calculation divides bytes by an invented constant rate. It is not a predicted rebuild time.
Real duration depends on the implementation, reconstruction scope, competing traffic, and effective throughput. The larger-drive configuration does not automatically rebuild more slowly in every comparison, and the twelve-drive configuration is not automatically more reliable.
RAID 6 provides tolerance for two member-drive failures within the group. That does not establish equal overall resilience between configurations or protect against every repository-level loss. Include the required independent recovery copy in the wider purchase scope.
Price the growth method, not just the empty bays
Ask the supplier how capacity will actually be added. Supported methods can include expanding an existing group, creating another group, adding an enclosure, or introducing another repository server. Each has different hardware, software, and migration requirements.
Dell’s virtual-disk expansion guidance documents controller-specific reconfiguration options and restrictions, including limitations for spanned layouts. An expansion feature supported by one controller does not establish support for another controller or storage stack.
For the eight-drive candidate, obtain a supported plan for using the four remaining bays. For the fully populated candidate, quote the next expansion step now. Include any enclosure, connectivity, additional repository resources, and required data movement.
Fix the storage architecture before accepting an expansion promise. The hardware versus software RAID comparison explains the controller and recovery dependencies that belong in that decision.
Calculate cost across eligible configurations
Compare acquisition cost only after capacity and performance qualification. Include the chassis, drives, spare inventory, controllers, backplanes, carriers, networking, software licensing, and matching support periods. Confirm the actual licensing basis rather than assuming disk count determines the fee.
Use measured or appropriately specified power inputs. Seagate’s Exos X24 data sheet separates idle and operating power specifications. Neither is automatically the repository’s long-term average.
Illustrative scenario: assume each installed HDD averages 8 W throughout five years of continuous operation. Four additional drives then add 32 W, or 1,401.6 kWh over 43,800 hours. At an assumed $0.15/kWh, that is approximately $210.24 in drive electricity.
This simplified calculation excludes cooling, power-supply losses, fans, controllers, and differences between drive models. It shows why a drive-count energy saving should be quantified before using it to justify a hardware premium.
Choose the configuration that meets the recovery contract
| Requirement | Starting preference | Required evidence |
|---|---|---|
| Capacity growth with moderate concurrency | Fewer larger drives in an expandable chassis | Restore qualification and a supported expansion method |
| Concurrent restores or tight processing windows | Evaluate more active drives | Application results proving useful additional parallelism |
| Strict recovery targets during rebuild | No preference from capacity alone | Degraded-operation and rebuild acceptance results |
| Lowest lifecycle cost | Least costly qualified complete configuration | Comparable hardware, support, power, and expansion scope |
If qualification suggests another redundancy layout, recalculate capacity and cost rather than carrying over the RAID 6 numbers. The RAID 1, RAID 5, and RAID 10 comparison provides context for those alternative tradeoffs.
Buying recommendation: choose fewer larger HDDs when they satisfy the recovery contract and leave a useful, supported growth path. Buy more active drives when testing demonstrates that their additional parallelism is needed. Approve the purchase against formatted capacity, restore results, degraded-operation requirements, and a complete expansion quotation.