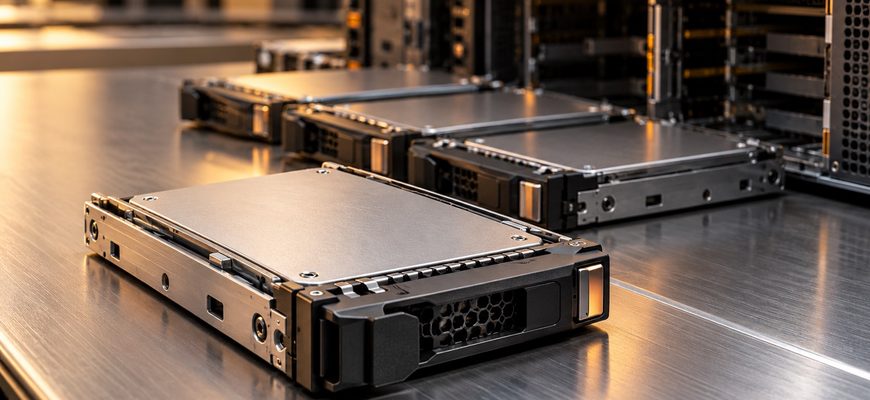
When comparing QLC vs TLC SSDs for servers, choose enterprise QLC when the exact drive meets your write budget, sustained performance target, and recovery window at a lower system cost. Choose enterprise TLC when concurrent writes or latency requirements exceed the qualified QLC option. A read-heavy workload alone does not settle the purchase: a small write percentage can still represent substantial daily writes.
The useful comparison is between complete storage configurations at the same usable capacity and service level. More capacity per drive can reduce bay consumption, but fewer drives also mean fewer devices sharing writes and recovery work. This guide assumes both candidates are enterprise NVMe SSDs; it does not compare a consumer QLC drive with an enterprise TLC product.
- QLC vs TLC SSDs: compare the purchasing constraints
- Measure daily writes before trusting the read percentage
- A transparent endurance screening model
- Make sustained writes and recovery purchase gates
- Compare cost per accepted configuration
- Choose by workload and the condition that changes the answer
- Procurement checklist
- Final buying recommendation
QLC vs TLC SSDs: compare the purchasing constraints
QLC stores four bits per cell; TLC stores three. The additional density creates a capacity opportunity, but the NAND label does not specify a finished SSD’s endurance, firmware behavior, or application latency. Kingston’s enterprise SSD discussion describes the roles of NAND, controller design, workload, and overprovisioning. Buy against the complete device specification.
| Criterion | Enterprise QLC candidate | Enterprise TLC candidate | Buying implication |
|---|---|---|---|
| Capacity economics | Worth evaluating for dense capacity tiers | May require more drives for the selected capacity point | Compare actual quotes and populated bays |
| Write endurance | Check model-specific TBW and workload conditions | Check endurance class; TLC alone is insufficient | Calculate writes per physical drive |
| Write performance | Validate sustained writes alongside foreground reads | Evaluate when the QLC candidate misses the target | Use the required workload and occupancy |
| Recovery behavior | Higher capacity per device can concentrate recovery work | More devices may distribute work differently | Measure degraded operation and rebuild time |
| Enterprise features | Require documented protection and platform support | Apply the same requirements | Do not infer features from NAND type |
Published products demonstrate why universal rules fail. Solidigm’s D5-P5430 product brief identifies QLC media, capacities up to 30.72 TB, and endurance up to 0.58 DWPD under a stated random-write workload. Its D7-P5520 and D7-P5620 brief identifies TLC products with different endurance classes. These are documented examples, not a current-price ranking or a substitute for exact-SKU qualification.
Measure daily writes before trusting the read percentage
A storage tier processing 100 TB of host I/O daily with 10% writes receives 10 TB of writes. Another processing 10 TB daily with 40% writes receives 4 TB. The first is more read-heavy yet has the larger write volume. This illustrative arithmetic assumes the percentages describe bytes, rather than I/O counts.
Collect physical-device host-write counters across representative business cycles. Include ingestion, compaction, snapshots, backups, maintenance, and recovery. Application payload is an unreliable substitute because the storage stack may create additional writes before data reaches the SSD.
Keep those software-generated writes separate from the SSD controller’s internal NAND write amplification. Kingston explains TBW, DWPD, and their relationship. Compare host writes with a vendor’s host-write endurance rating under its specified workload; do not multiply by an assumed internal amplification factor and count the same wear twice. Confirm how your workload differs from the rating conditions.
A transparent endurance screening model
Use daily host writes divided by rated drive capacity to estimate required DWPD. For a five-year planning horizon, multiply average daily host writes by 1,825 to estimate lifetime host writes. Use the vendor’s published TBW as the approval limit; rounded DWPD figures may not reproduce it exactly.
Consider two hypothetical candidates: a 15.36 TB QLC SSD rated at 0.3 DWPD and a 7.68 TB TLC SSD rated at 1 DWPD, both over five years. These assumptions are not specifications for the products mentioned above.
| Planning measure | Hypothetical QLC | Hypothetical TLC |
|---|---|---|
| Rated capacity per drive | 15.36 TB | 7.68 TB |
| Assumed DWPD | 0.3 | 1.0 |
| Calculated daily write allowance | 4.608 TB | 7.68 TB |
| Calculated five-year writes | 8,409.6 TB | 14,016 TB |
| Utilization at 3 TB host writes per day | 65.1% | 39.1% |
At 3 TB daily, both pass this initial endurance screen. If the QLC device instead receives 6 TB daily, it exceeds the assumed allowance. Approval therefore depends on device-level write distribution and projected growth, rather than the phrase “read-intensive.” Passing this screen does not establish performance or predict failure dates.
Set an explicit allowance for growth and exceptional activity. Evaluate the busiest device, not just the array average. For mirrored or parity layouts, derive per-drive writes from the intended configuration or a representative pilot. Keep filesystem free space and application-usable capacity separate from the rated device capacity used in the endurance calculation.
Make sustained writes and recovery purchase gates
A drive can have sufficient lifetime endurance and still miss a write completion window. Endurance measures an amount of writing; sustained throughput measures how quickly it can be completed. Neither metric establishes foreground read latency during concurrent maintenance.
Ask for an acceptance test using the exact capacity, firmware, protection layout, and expected occupancy. Precondition the drives to representative steady-state behavior. Run the intended read/write mix long enough to expose background work rather than relying on short burst results.
- Measure foreground read latency while ingestion or compaction runs.
- Check the required latency percentile, queue depth, and throughput together.
- Repeat at expected end-of-life capacity utilization.
- Measure degraded-array performance and replacement-drive rebuild time.
- Validate cooling in the populated chassis and intended inlet conditions.
Density also changes the recovery unit. Replacing one larger device may require reconstructing more data, although actual time depends on data layout, occupancy, bandwidth limits, and foreground traffic. Do not assume recovery time simply doubles with drive capacity. Require the proposed topology to meet the recovery window.
Keep architecture choices explicit: the hardware RAID versus software RAID comparison addresses controller and recovery dependencies. A NAND substitution does not remove those dependencies.
Compare cost per accepted configuration
A lower quoted price per raw terabyte is useful only after capacity, performance, endurance, and availability requirements pass. Normalize protection overhead, reserved free space, spares, and the usable capacity actually needed. If the workload needs more drives for performance, a capacity-only consolidation estimate overstates savings.
For an illustrative acquisition comparison, assume eight 15.36 TB QLC drives at $1,500 each versus sixteen 7.68 TB TLC drives at $900 each. Assume four mirrored pairs versus eight mirrored pairs, identical 20% free-space reserves, and one purchased spare of the matching type. These are hypothetical prices, not market quotes.
Both designs provide 61.44 TB after mirroring and 49.152 TB after the reserve. QLC acquisition cost including its spare is $13,500; TLC is $15,300. The initial difference is $1,800. If qualifying the QLC design requires $2,500 of additional hardware or engineering, that advantage disappears before energy or service costs are considered.
This is a limited acquisition model, not a complete TCO result or benchmark. Complete the comparison with measured system power, support charges, replacement labor, and any additional nodes required for performance or availability. Fewer drives do not automatically mean a smaller electricity bill: compare watts for the complete accepted configuration.
Choose by workload and the condition that changes the answer
| Workload | Starting shortlist | Condition that changes the recommendation |
|---|---|---|
| Read-mostly content or object capacity tier | Enterprise QLC | Ingestion, rewrites, or recovery miss the required window |
| Analytics dataset or local model repository | Compare QLC and TLC | Frequent refreshes or scratch writes dominate the storage load |
| Shared VM datastore with changing workloads | Enterprise TLC as the initial candidate | A QLC pilot meets peak mixed-I/O targets with documented headroom |
| Transaction logs or sustained write-heavy ingestion | Appropriately rated enterprise TLC | An alternative qualified device demonstrably meets both endurance and latency requirements |
These are screening recommendations, not claims that every TLC SSD outperforms every QLC model. Keep hot write paths on a separately qualified tier when that makes the capacity tier economical. Include the extra devices, bays, support, and engineering in the combined cost.
Procurement checklist
- Specify usable capacity after protection and free-space reserves.
- Record average, peak, and projected host writes per physical drive.
- Verify exact-SKU TBW, warranty term, and workload assumptions.
- Require sustained throughput and latency results at representative occupancy.
- Set degraded-operation and rebuild acceptance limits.
- Confirm power-loss protection, firmware support, and platform qualification.
- Verify backplane, interface, carrier, cooling, and hot-plug compatibility.
- Price spares and the complete configuration over the intended service life.
Apply the same enterprise safeguards to both candidates; the enterprise versus consumer SSD guide covers that separate qualification decision. Check the U.2, E1.S, and E3.S form-factor comparison before assuming a higher-capacity drive fits the proposed chassis.
Final buying recommendation
Buy enterprise QLC for capacity-oriented server storage when the exact configuration passes endurance, sustained mixed-I/O performance, and recovery tests and still costs less. Pay for a qualified TLC configuration when its additional capability is necessary to meet those targets. If the QLC candidate already passes with adequate growth allowance, the TLC premium needs a specific, measurable benefit to justify it.